Chart
This article contains general information on how to customize and control the chart. For more information about certain chart elements, refer to the rest of the articles in the UI Elements section.
Default chart settings
You should use the Widget Constructor to set up default chart settings like symbol, resolution, time zone, locale, size, and others. Refer to the Widget Constructor article for more information.
Customization
Refer to the Customization section for detailed information on how to customize the chart and its elements.
Change colors
You can customize the colors of the chart to implement your corporate colors. The articles listed below explain how to change colors in certain cases:
- Chart Overrides: specify default color of UI elements on the chart like scales and panes.
- Custom themes API: specify default color of UI elements outside the chart like dialogs and toolbars.
Show/hide chart elements
You can show/hide chart elements using featuresets. If there is no featureset for an element you want to hide, you can do it by adding your custom CSS file.
Show/hide gaps on the chart
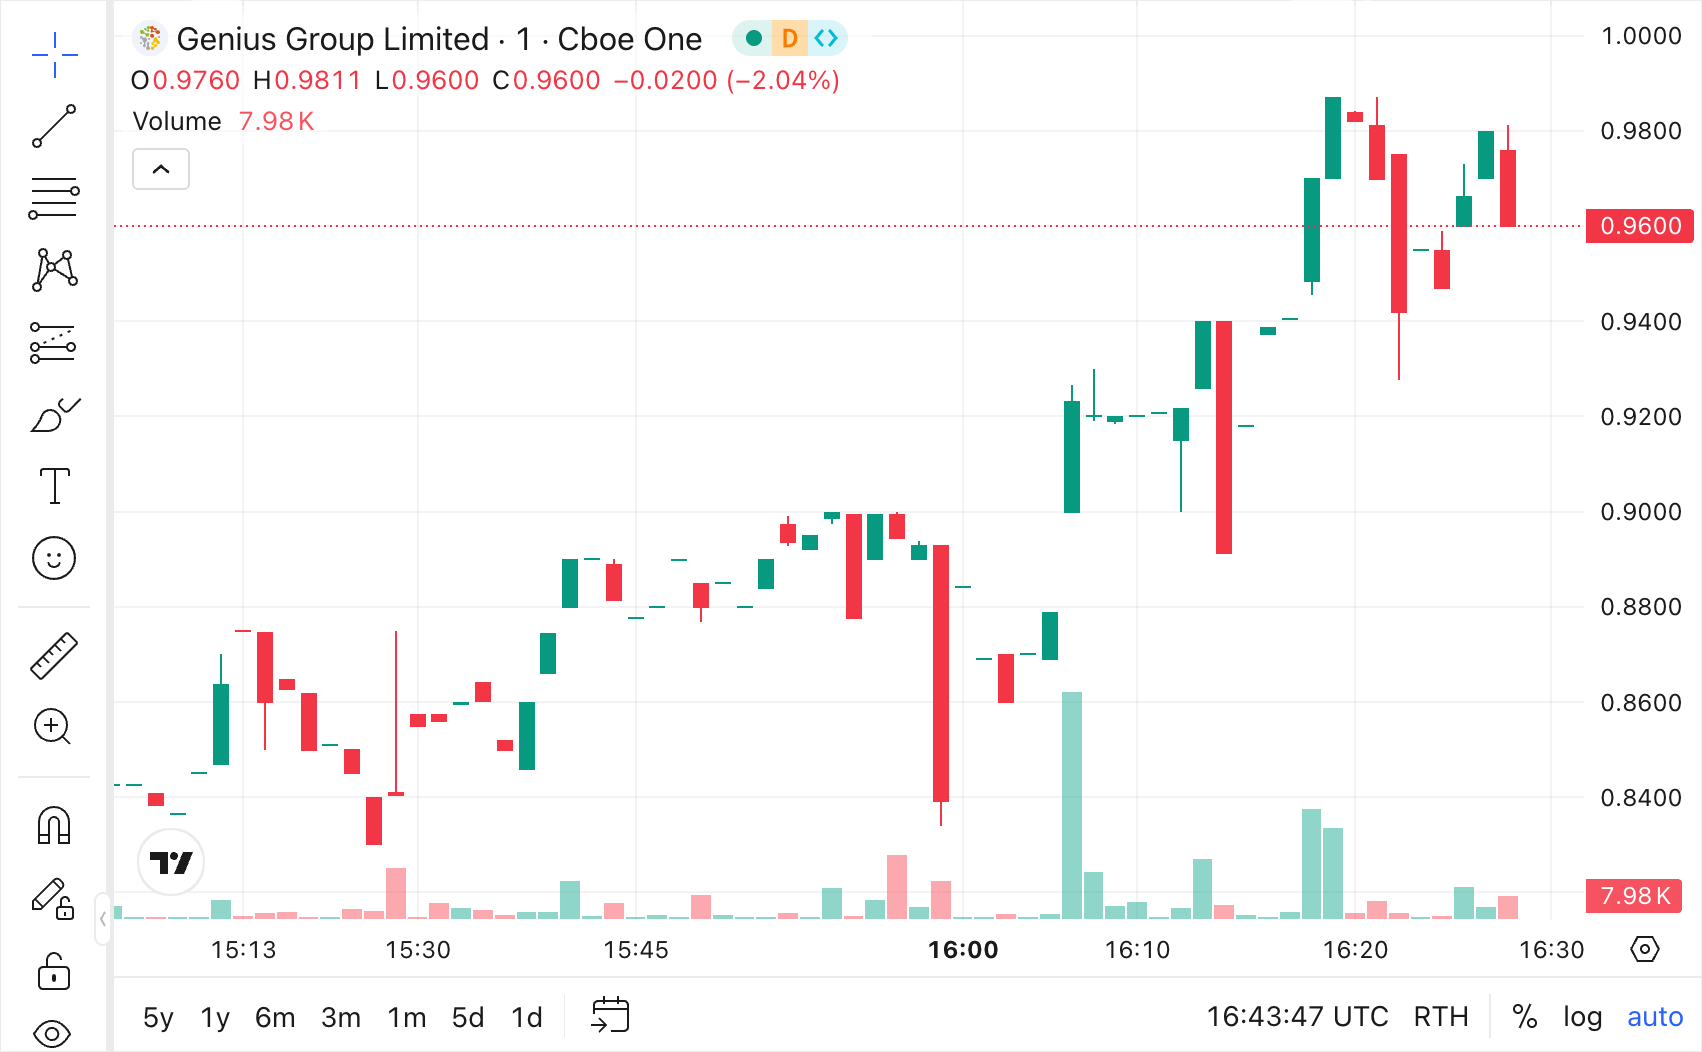
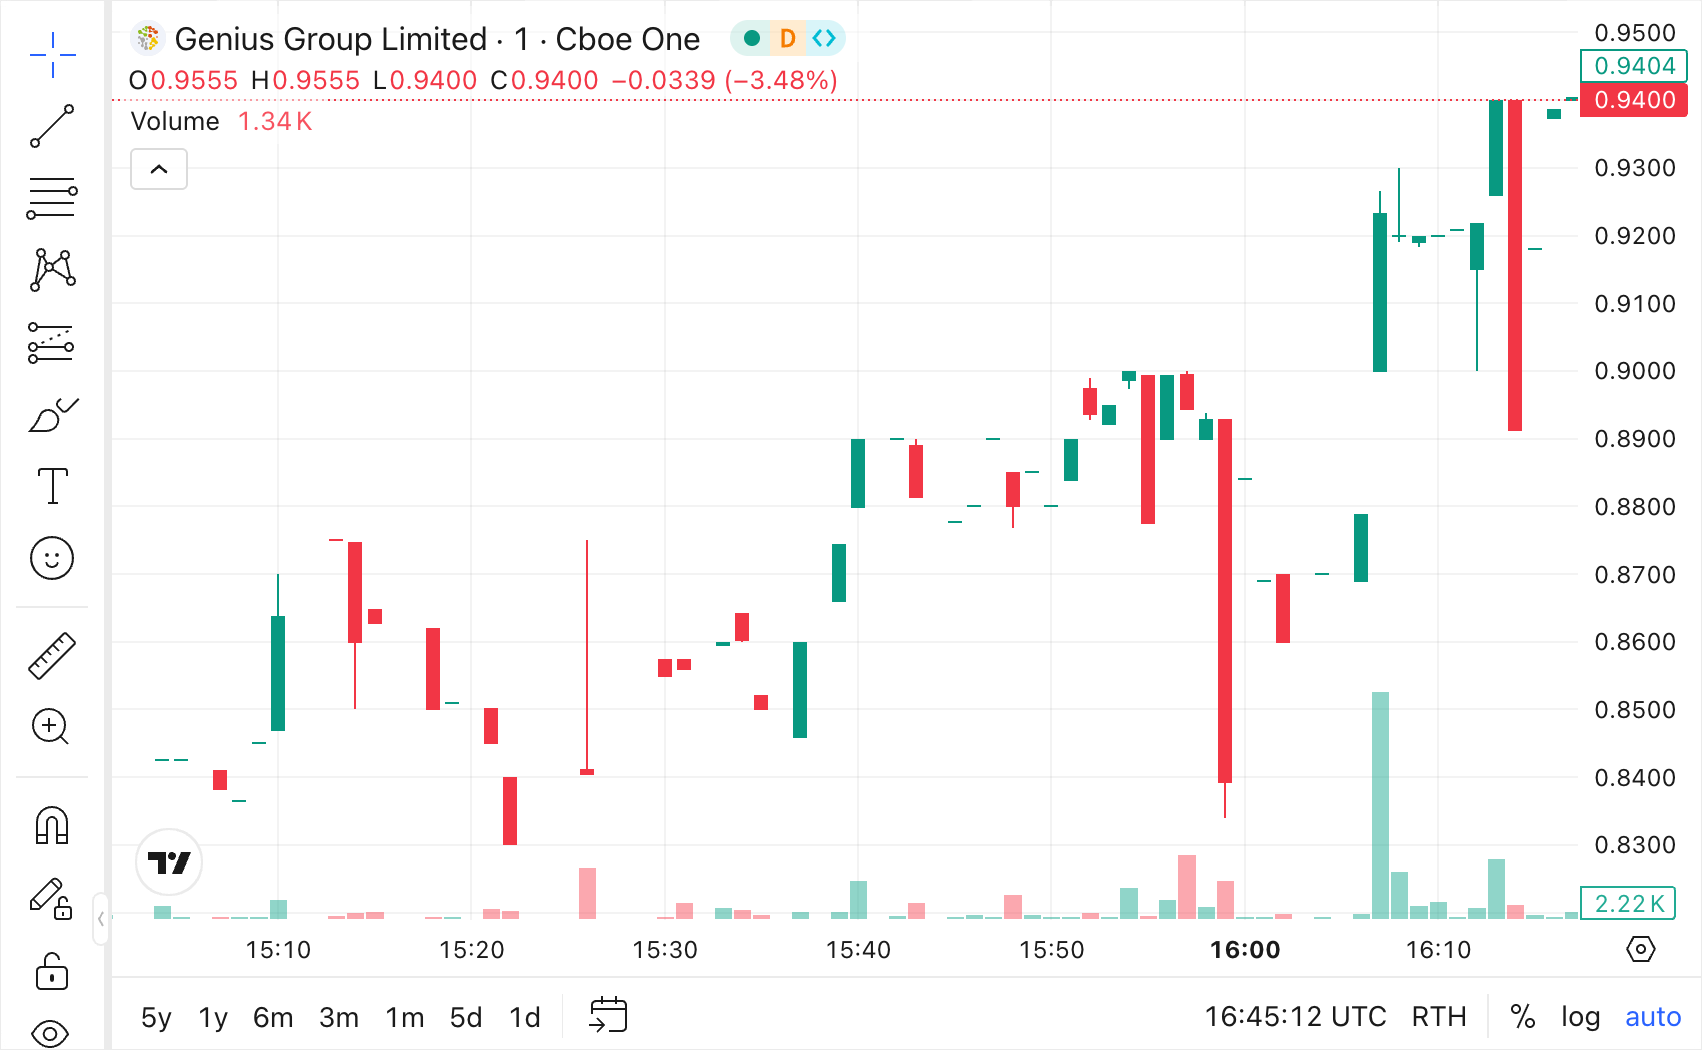
By default, the library hides periods with no trading activity to keep the chart continuous. In certain cases, such as analyzing low-liquidity instruments, it might be useful to represent these periods with whitespace gaps on the chart.
To do this, use the inactivity_gaps featureset. Note that inactivity gaps are displayed only within the trading session of the instrument. For example, for a U.S. stock with a trading session from 09:00 to 16:00, inactivity outside of the session will not be displayed.
- Chart without gaps
- Chart with gaps


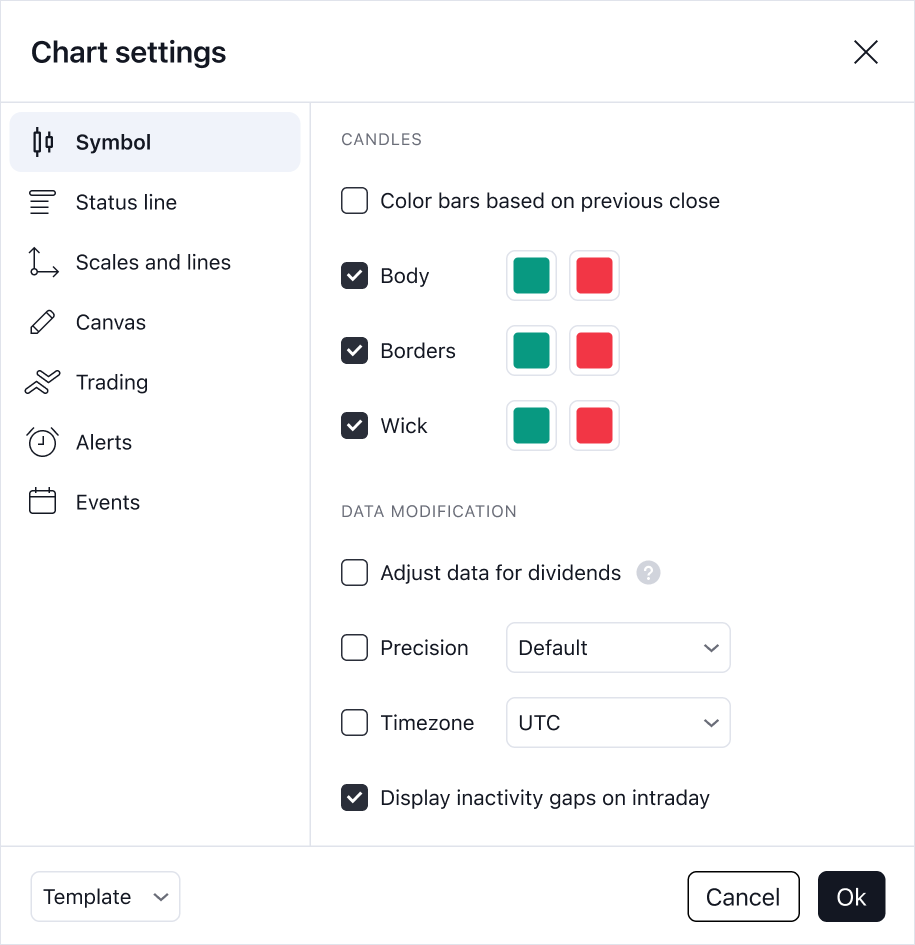
When inactivity_gaps is enabled, the corresponding checkbox appears in the Chart settings dialog, allowing users to toggle inactivity gaps on or off. The checkbox is disabled by default.

You can also use the inactivityGaps method to control the gaps visibility through the API.
// Access the watched value for inactivity gaps visibility
const inactivityGaps = widget.chart().inactivityGaps();

// Enable inactivity gaps display
inactivityGaps.set(true);

// Listen for changes
inactivityGaps.subscribe((isVisible) => {
  console.log('Inactivity gaps visibility changed by the user:', isVisible);
});
Chart methods
You can use the Chart API to interact with the chart after it is initialized. For example, you can subscribe to chart events, manage drawings and indicators, get information about a current configuration, perform Z-order operations, and more. All methods are listed in IChartWidgetApi.
Subscribe to events
You can subscribe to the chart events using methods like onDataLoaded, onSymbolChanged, onChartTypeChanged, and others.
For example, the code sample below specifies a time frame when an interval is changed using the onIntervalChanged method.
widget.activeChart().onIntervalChanged().subscribe(null, (interval, timeframeObj) =>
    timeframeObj.timeframe = {
        value: '12M',
        type: 'period-back'
});
Manage chart
You can manage chart settings using methods like setSymbol, setResolution, resetData, clearMarks, and others.
For example, the code sample below specifies a new range using the setVisibleRange method.
widget.activeChart().setVisibleRange(
    { from: Date.UTC(2023, 6, 12, 13, 30) / 1000 },
    { applyDefaultRightMargin: true }
)
Apply overrides
You can use the applyOverrides method to change the properties of a specific chart on the fly.
This is particularly useful in multiple-chart layouts when you want to apply settings to one chart without affecting others.
For example, the code sample below hides the legend on the first chart only:
// Access the first chart in the layout
const firstChart = widget.chart(0);

// Apply overrides specifically to this chart
firstChart.applyOverrides({
    "paneProperties.legendProperties.showLegend": false
});
For a full list of available properties, refer to the Chart overrides article.
Execute action by ID
The executeActionById method allows you to trigger specific actions programmatically through the API.
This is useful for customizing UI or replicating built-in functionality with custom components.
For example, you can replace built-in top toolbar buttons with custom ones or trigger actions for hidden UI elements.
widget.activeChart().executeActionById("chartReset");
Click to reveal the list of the ChartActionId types.
ChartActionId types.| Action ID | Purpose |
|---|---|
"addPlusButton" | Enables or disables the Plus button on the price scale for quick trading. |
"chartProperties" | Opens the Chart settings dialog. |
"compareOrAdd" | Opens or hides the Compare symbol dialog. |
"scalesProperties" | Opens or hides the Chart settings dialog. |
"paneObjectTree" | Opens the Object tree on the widget bar. |
"insertIndicator" | Opens or hides a dialog for adding indicators. |
"symbolSearch" | Opens the Symbol Search dialog. |
"changeInterval" | Opens a dialog for changing resolution. |
"timeScaleReset" | Resets the time scale to its default state. |
"chartReset" | Resets the chart view to its default state. |
"seriesHide" | Hides the selected series on the chart. |
"studyHide" | Hides the selected indicator on the chart. |
"lineToggleLock" | Enables or disables the Lock/Unlock button in the floating toolbar of the selected drawing. |
"lineHide" | Hides the selected drawing on the chart. |
"scaleSeriesOnly" | Enables or disables the Scale price chart only option for the price scale. |
"drawingToolbarAction" | Opens or hides the drawing toolbar. |
"stayInDrawingModeAction" | Enables or disables the Stay in drawing mode. |
"hideAllMarks" | Shows or hides all marks on the chart. |
"showCountdown" | Enables or disables Countdown to bar close option for the price scale. |
"showSeriesLastValue" | Shows or hides the series's last value on the price scale. |
"showSymbolLabelsAction" | Shows or hides the symbol's label on the price scale. |
"showStudyLastValue" | Shows or hides the indicator's last value on the price scale. |
"showStudyPlotNamesAction" | Shows or hides the indicator's label on the price scale. |
"undo" | Undoes the last applied action. |
"redo" | Redoes the last undone action. |
"paneRemoveAllStudiesDrawingTools" | Removes all indicators and drawings from the chart. |
"showSymbolInfoDialog" | Opens the Security info dialog. |
Manage drawings and indicators
You can create and manage drawings/indicators using methods like createStudy, getAllShapes, getShapeById, removeAllStudies, and others.
For example, the code sample below adds the Vertical line drawing on the chart using the createShape method.
widget.activeChart().createShape(
    { time: 1514764800 },
    { shape: 'vertical_line' }
);
Enable drag-to-export feature
The drag-to-export feature allows users to drag the chart area to export data to external applications. For example, a user can drag the chart into a text editor to paste JSON data.
To implement this feature:
- Enable the
chart_drag_exportfeatureset. - Call the
setDragExportEnabled(true)method on the active chart. - Subscribe to the
dragstartevent. - Define the event handler. The handler receives a
DragStartParamsobject. You can use its properties to define the drag behavior:keysto trigger the export only when specific modifier keys are pressed.setDatato attach data to the drag event. If you do not call this method, the drag is ignored, and normal chart interaction continues.setDragImageto set a custom visual element for the drag operation.
The example below enables the feature and exports chart data as JSON. The drag is only triggered if the user presses the Meta (Command) key.
Getters
You can get information about the current chart settings using methods like symbol, chartType, getVisibleRange, and others.
For example, the code sample below gets the current resolution using the resolution method.
console.log(widget.activeChart().resolution());
You can also use chart methods to get objects that provide API to perform certain operations. For example:
getSeriesreturnsISeriesApithat allows you to interact with a series.selectionreturnsISelectionApithat allows you to select drawings and indicators.getTimezoneApireturnsITimezoneApithat allows you to manage the chart's time zone.