Chart overrides
This article describes Overrides API properties that affect elements on the chart. You can find a full list of properties on the ChartPropertiesOverrides page.
All properties are divided into four groups:
paneProperties— affect elements on the main chart pane.scalesProperties— affect price and time scales.mainSeriesProperties— affect series.tradingProperties— affect Trading Platform features.
paneProperties
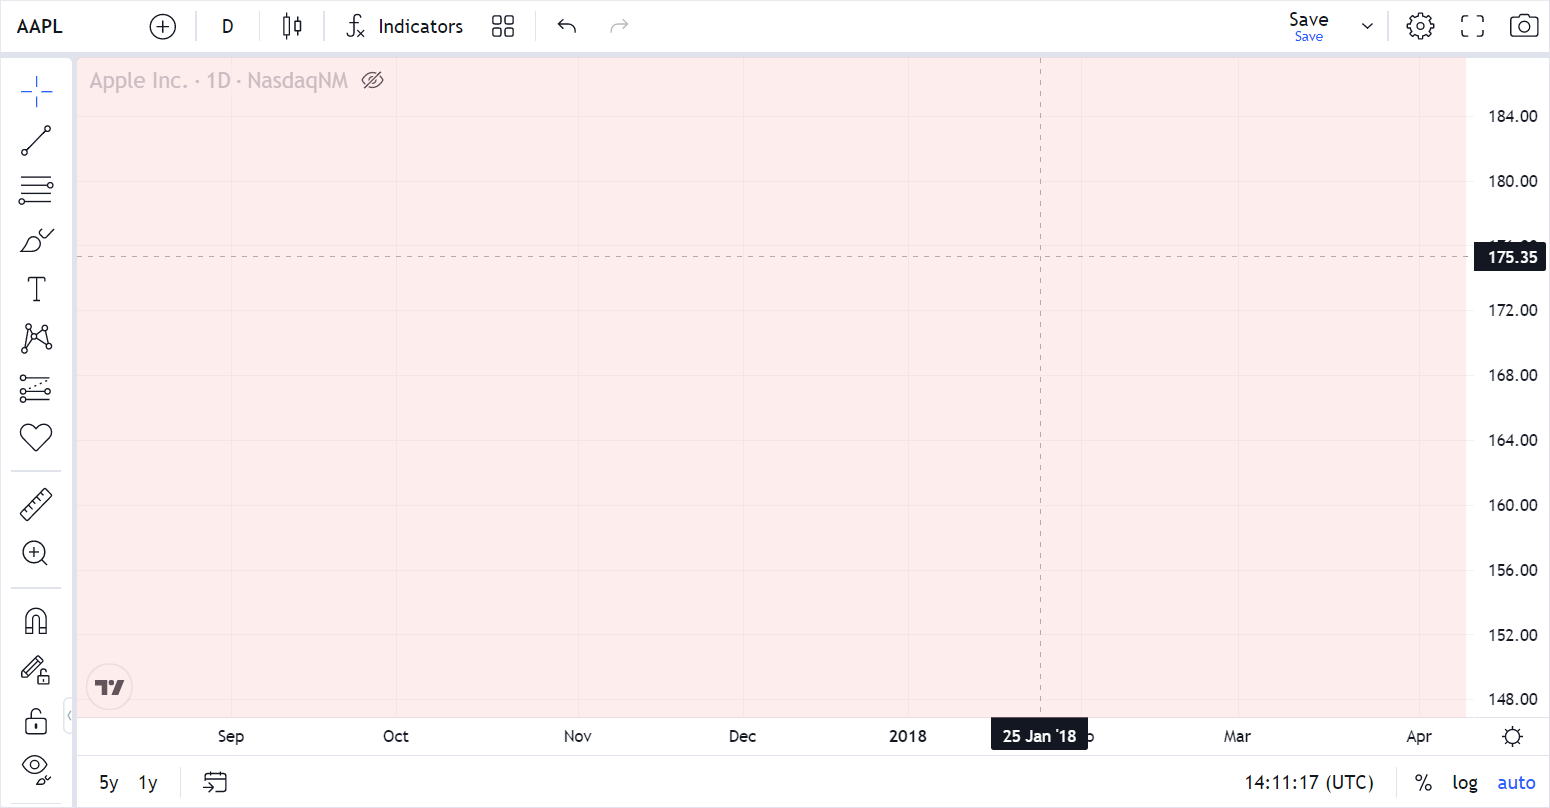
These properties affect elements located on the chart's pane (inside the highlighted area).

Chart background color
You can specify a background color using the following properties:
| Property | Description |
|---|---|
paneProperties.backgroundType | Pane background type. |
paneProperties.background | Pane background color. |
paneProperties.backgroundGradientStartColor | Pane background gradient start color. |
paneProperties.backgroundGradientEndColor | Pane background gradient end color. |
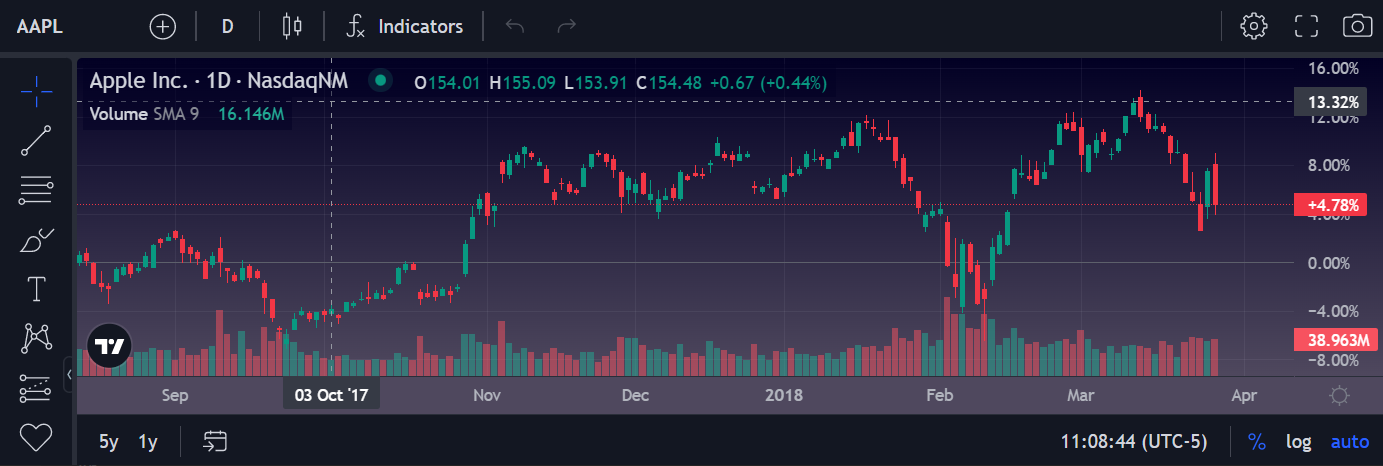
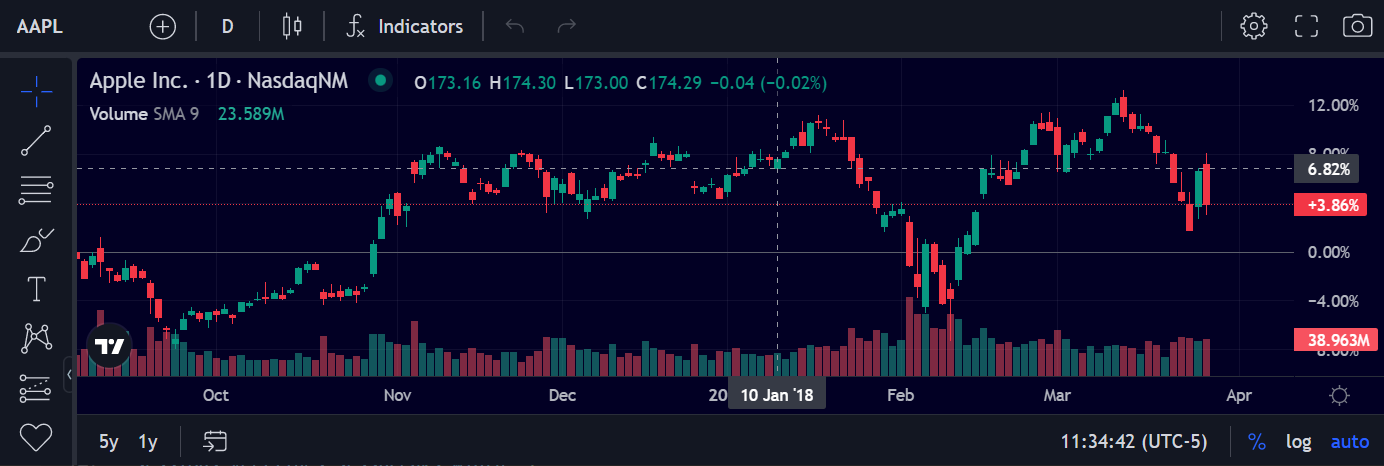
Background color can be either solid or gradient. Note that the default background type is gradient in the dark theme. The following code samples demonstrate how to specify background in the dark theme:
var widget = (window.tvWidget = new TradingView.widget({
    // ...
    theme: "dark",
    overrides: {
        "paneProperties.backgroundGradientStartColor": "#020024",
        "paneProperties.backgroundGradientEndColor": "#4f485e",
    },
}));

var widget = (window.tvWidget = new TradingView.widget({
    // ...
    theme: "dark",
    overrides: {
        "paneProperties.background": "#020024",
        "paneProperties.backgroundType": "solid"
    },
}));

Grid lines
You can specify grid lines using the following properties:
| Property | Description |
|---|---|
paneProperties.vertGridProperties.color | Pane vertical grid color. |
paneProperties.vertGridProperties.style | Pane vertical grid line style. |
paneProperties.horzGridProperties.color | Pane horizontal grid color. |
paneProperties.horzGridProperties.style | Pane horizontal grid line style. |
paneProperties.gridLinesMode | Pane grid line mode. |
The code sample below specifies a dotted grid line.
var widget = (window.tvWidget = new TradingView.widget({
    // ...
    overrides: {
        "paneProperties.horzGridProperties.style": 1,
    },
}));
Pane separator
You can change the color of the pane separator using the following property (it's also available in Chart settings but you'll have to at least have a pane in addition to main series to see it):
| Property | Description |
|---|---|
paneProperties.separatorColor | Pane separator color. |
Here's a code sample:
var widget = (window.tvWidget = new TradingView.widget({
    // ...
    overrides: {
        "paneProperties.separatorColor": "#9598a1"
    },
}));
Legend
You can specify a legend using the following properties:
| Property | Description |
|---|---|
paneProperties.legendProperties.showLastDayChange | Ability to show daily changes in the chart legend. |
paneProperties.legendProperties.showStudyArguments | Study legend input values visibility. |
paneProperties.legendProperties.showStudyTitles | Studies legend title visibility. |
paneProperties.legendProperties.showStudyValues | Studies legend value visibility. |
paneProperties.legendProperties.showSeriesTitle | Series legend title visibility. |
paneProperties.legendProperties.showSeriesOHLC | Study legend OHLC values visibility. |
paneProperties.legendProperties.showBarChange | Series legend change value visibility. |
paneProperties.legendProperties.showSeriesLegendCloseOnMobile | Series legend close value visibility on mobile. |
paneProperties.legendProperties.showVolume | Series legend volume value visibility. |
paneProperties.legendProperties.showBackground | Legend background visibility. |
paneProperties.legendProperties.backgroundTransparency | Legend background transparency percentage. |
Some properties that relate to the mainSeriesProperties group also affect the chart's legend.
| Property | Description |
|---|---|
mainSeriesProperties.statusViewStyle.showExchange | Main series legend exchange visibility. |
mainSeriesProperties.statusViewStyle.showInterval | Main series legend interval visibility. |
mainSeriesProperties.statusViewStyle.symbolTextSource | Main series legend text style. |
The code sample below removes OHLCV values and chart resolution from the legend. It also specifies the "long-description" text style in the legend.
var widget = (window.tvWidget = new TradingView.widget({
    // ...
    overrides: {
        "paneProperties.legendProperties.showVolume": false,
        "paneProperties.legendProperties.showSeriesOHLC": false,

        "mainSeriesProperties.statusViewStyle.showInterval": false,
        "mainSeriesProperties.statusViewStyle.symbolTextSource": "long-description",
    },
}));

Margin
Use the following properties to specify a margin applied when users scale the chart:
| Property | Description |
|---|---|
paneProperties.topMargin | Pane auto scaling top margin percentage. |
paneProperties.bottomMargin | Pane auto scaling bottom margin percentage. |
Crosshair
You can specify a crosshair using the following properties:
| Property | Description |
|---|---|
paneProperties.crossHairProperties.color | Crosshair color. |
paneProperties.crossHairProperties.style | Crosshair style. |
paneProperties.crossHairProperties.transparency | Crosshair transparency. To use this property, specify paneProperties.crossHairProperties.color with a hexadecimal value such as #ff0000. Otherwise, transparency is not applied. |
paneProperties.crossHairProperties.width | Crosshair width. |
scalesProperties
These properties affect appearance of the time and price scales.
Price scale position
You can use the priceScaleSelectionStrategyName property to specify a price scale position.
If you want to change the price scale position on the fly, you should use the changePriceScale method.
widget.activeChart().getSeries().changePriceScale('new-left');
Scale colors and fonts
You can specify scale colors and fonts using the following properties:
| Property | Description |
|---|---|
scalesProperties.lineColor | Scales (axis) border line color. |
scalesProperties.textColor | Scales (axis) text color. |
scalesProperties.fontSize | Scales (axis) font size. |
scalesProperties.axisHighlightColor | Sets the highlight color of the scales when adding a drawing. |
Labels on the scale
Advanced Charts and Trading Platform include labels that allow you to display additional information on the price scale like a symbol name, bid/ask prices, indicators, and more. You can use the properties below to enable these labels:
| Property | Description |
|---|---|
scalesProperties.showSeriesLastValue | Series last value label visibility. |
scalesProperties.showStudyLastValue | Study label value label visibility. |
scalesProperties.showSymbolLabels | Symbol name label visibility. |
scalesProperties.showStudyPlotLabels | Study plot labels visibility. |
scalesProperties.showBidAskLabels | Bid/ask labels visibility. |
scalesProperties.showPrePostMarketPriceLabel | Pre/post market price labels visibility. |
mainSeriesProperties.highLowAvgPrice.highLowPriceLabelsVisible | High/low price labels visibility. |
mainSeriesProperties.highLowAvgPrice.averageClosePriceLabelVisible | Average close price lines label visibility. |
You can display values focused in the crosshair in labels on the scales. To do this, specify the following properties:
| Property | Description |
|---|---|
scalesProperties.showPriceScaleCrosshairLabel | Price scale crosshair label visibility. |
scalesProperties.showTimeScaleCrosshairLabel | Time scale crosshair label visibility. |
scalesProperties.crosshairLabelBgColorLight | Crosshair label light theme background color. |
scalesProperties.crosshairLabelBgColorDark | Crosshair label dark theme background color. |
You can specify label colors and display mode using the properties below:
| Property | Description |
|---|---|
mainSeriesProperties.priceAxisProperties.alignLabels | Main series price axis label alignment behavior. |
scalesProperties.axisLineToolLabelBackgroundColorActive | Dynamically changes the background color of all labels on the price scale when a drawing is in motion. |
scalesProperties.axisLineToolLabelBackgroundColorCommon | Configures the background color of a label shown on an axis scale when a drawing is selected. |
scalesProperties.seriesLastValueMode | Series last value label display mode. |
Price scale mode
You can specify a price scale mode using the following properties:
| Property | Description |
|---|---|
mainSeriesProperties.priceAxisProperties.percentage | Main series price axis percentage mode. |
mainSeriesProperties.priceAxisProperties.indexedTo100 | Main series price axis indexed to 100 mode. |
mainSeriesProperties.priceAxisProperties.log | Main series price axis log mode. |
mainSeriesProperties.priceAxisProperties.isInverted | Main series price axis inverted mode. |
Note that you cannot change the price scale mode using the applyOverrides method. If you want to change the mode on the fly, you should use the Price Scale API. Consider the code sample below that enables Logarithmic mode:
const priceScale = widget.activeChart().getPanes()[0].getRightPriceScales()[0];
priceScale.setMode(1);
mainSeriesProperties
These properties affect the main series and UI elements related to its values. A series is a collection of data points that represents a specific metric over time.
Series visibility
If you want to hide the main series, set the mainSeriesProperties.visible property to false.
You can also use the setVisible method to change the visibility of the series on the fly.
widget.activeChart().getSeries().setVisible(true);
To check if the series is currently visible or not, use the isVisible method:
widget.activeChart().getSeries().isVisible();
Chart styles
Advanced Charts and Trading Platform support multiple chart styles including Bars, Candles, Line, Area, and more.
You can specify the style using the mainSeriesProperties.style property.
For each style, there is a group of properties that you can specify to adjust the main series. Properties of one group have the same name pattern. You can use these patterns to find properties for a certain style on the ChartPropertiesOverrides page. The table below contains styles and the corresponding patterns.
| Style | Name patterns |
|---|---|
| Line | mainSeriesProperties.lineStyle |
| Baseline | mainSeriesProperties.baselineStyle |
| Stepline | mainSeriesProperties.steplineStyle |
| Bars | mainSeriesProperties.barStyle |
| Candles | mainSeriesProperties.candleStyle |
| Volume candles | mainSeriesProperties.volCandlesStyle |
| Area | mainSeriesProperties.areaStyle |
| HLC Area | mainSeriesProperties.hlcAreaStyle |
| HLC bars | mainSeriesProperties.hlcBarsStyle |
| Line With Markers | mainSeriesProperties.lineWithMarkersStyle |
| Hollow Candles | mainSeriesProperties.hollowCandleStyle |
| Heikin Ashi | mainSeriesProperties.haStyle |
| Columns | mainSeriesProperties.columnStyle |
| High-low | mainSeriesProperties.hiloStyle |
| Renko | mainSeriesProperties.renkoStyle |
| Line Break | mainSeriesProperties.pbStyle |
| Kagi | mainSeriesProperties.kagiStyle |
| Point-and-Figure | mainSeriesProperties.pnfStyle |
You can also change the chart style properties on the fly. To do this, use the setChartStyleProperties method.
For example, the code sample changes the properties of the Candles style.
widget.chart().getSeries().setChartStyleProperties(1, {
    upColor: '#10F9E0',
    downColor: '#1029F9',
    borderUpColor: '#10F9E0',
    borderDownColor: '#1029F9'
});

Properties that can be changed using setChartStyleProperties are listed in interfaces like BarStylePreferences, RenkoStylePreferences, and AreaStylePreferences.
Refer to the SeriesPreferencesMap page to see the list of such interfaces.
Session
Advanced Charts and Trading Platform support pre-market and post-market sessions. To enable them, you should set the mainSeriesProperties.sessionId to "extended". For more information about the sessions, refer to Trading Sessions and Extended Sessions.
Countdown
On the price scale, you can display a countdown to the bar close. To do this, set the mainSeriesProperties.showCountdown property to true.
Note that you should also implement the getServerTime method to display the countdown.
Price line
You can specify a price line using the following properties:
| Property | Description |
|---|---|
mainSeriesProperties.showPriceLine | Main series price line visibility. |
mainSeriesProperties.priceLineWidth | Main series price line width. |
mainSeriesProperties.priceLineColor | Main series price line color. |
Additional lines
Advanced Charts and Trading Platform include additional lines that can be displayed on the chart. You can enable them using the toggle properties in the table below. For each line, there is a group of properties that you can specify to adjust this line. Properties of one group have the same name pattern. You can use these patterns to find properties for a certain line on the ChartPropertiesOverrides page.
| Line | Toggle | Name patterns |
|---|---|---|
| Bid/ask | mainSeriesProperties.bidAsk.visible | mainSeriesProperties.bidAsk |
| High/low price | highLowAvgPrice.highLowPriceLinesVisible | mainSeriesProperties.highLowAvgPrice |
| Previous close price | mainSeriesProperties.showPrevClosePriceLine | mainSeriesProperties.prevClosePrice |
minTick
The minTick property allows you to change the pricescale, minmov, and fractional properties for the current symbol at once. For more information about these properties, refer to Price Format.
All minTick possible values are represented below as objects for better readability:
{ priceScale: 1, minMove: 1, frac: false },
{ priceScale: 10, minMove: 1, frac: false },
{ priceScale: 100, minMove: 1, frac: false },
{ priceScale: 1000, minMove: 1, frac: false },
{ priceScale: 10000, minMove: 1, frac: false },
{ priceScale: 100000, minMove: 1, frac: false },
{ priceScale: 1000000, minMove: 1, frac: false },
{ priceScale: 10000000, minMove: 1, frac: false },
{ priceScale: 100000000, minMove: 1, frac: false },
{ priceScale: 2, minMove: 1, frac: true },
{ priceScale: 4, minMove: 1, frac: true },
{ priceScale: 8, minMove: 1, frac: true },
{ priceScale: 16, minMove: 1, frac: true },
{ priceScale: 32, minMove: 1, frac: true },
{ priceScale: 64, minMove: 1, frac: true },
{ priceScale: 128, minMove: 1, frac: true },
{ priceScale: 320, minMove: 1, frac: true },
If you want to reset the pricescale, minmov, and fractional properties to their values initialized in LibrarySymbolInfo, set minTick to "default".
Specify the mainSeriesProperties.minTick property as demonstrated below:
// Set minTick to "default"
tvWidget.applyOverrides({ "mainSeriesProperties.minTick": "default" });

// Set series' minTick to { priceScale: 10000, minMove: 1, frac: false }
tvWidget.applyOverrides({ "mainSeriesProperties.minTick": "10000,1,false" });

// Set minTick for overlay studies to { priceScale: 10000, minMove: 1, frac: false }
tvWidget.applyStudiesOverrides({ "overlay.minTick": "10000,1,false" });
Time zone
If you want to change a time zone that is set in Widget Constructor, you should use the timezone property.
tvWidget.applyOverrides({ "timezone": "Europe/Belgrade"});
Trading Platform
You can use tradingProperties to customize Trading Platform features such as orders and positions.
Refer to the Trading overrides for more information.