Custom indicators defaults
Overview
The defaults property in StudyMetaInfo stores the default values of the custom indicator settings, such as input values, plot styles, and band styles.
The library applies these values when a user adds the indicator to the chart.
Users can restore them in the indicator's Settings dialog by selecting Defaults → Reset settings.
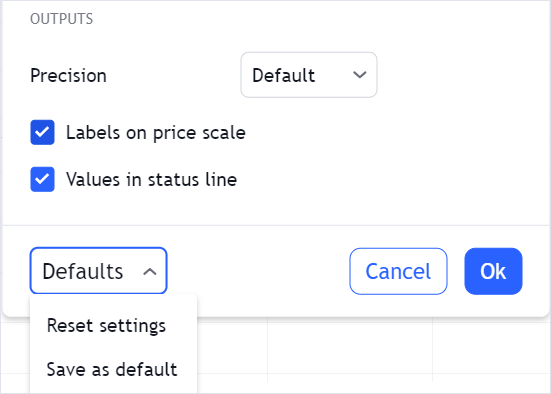
defaults implements the StudyDefaults interface. The code sample below shows defaults for an indicator with an input, a line plot, two bands, and a filled area between them.
metainfo: {
    // ...
    plots: [{ id: "plot_0", type: "line" }],
    inputs: [{ id: "length", name: "Length", type: "integer", defval: 14 }],
    bands: [
        { id: "upper", name: "Upper band" },
        { id: "lower", name: "Lower band" },
    ],
    filledAreas: [
        { id: "fill_0", objAId: "upper", objBId: "lower", title: "Background", type: "hline_hline" },
    ],
    // StudyDefaults object
    defaults: {
        inputs: {
            length: 14,
        },
        styles: {
            plot_0: {
                plottype: 0, // Line
                linestyle: 0, // Solid
                linewidth: 2,
                color: "#2962FF",
                trackPrice: false,
                visible: true,
            },
        },
        bands: [
            { color: "#787B86", linestyle: 2, linewidth: 1, value: 70, visible: true },
            { color: "#787B86", linestyle: 2, linewidth: 1, value: 30, visible: true },
        ],
        filledAreasStyle: {
            fill_0: { color: "#7E57C2", transparency: 90, visible: true },
        },
    },
}
Properties
All properties in defaults are optional, except for inputs if the indicator has input parameters.
| Property | Description |
|---|---|
inputs | Default input values. Keys are input id values from inputs. Refer to Inputs for more information. |
styles | Default plot styles. Keys are plot id values from plots. |
ohlcPlots | Default styles of the OHLC plots. Keys are id values from ohlcPlots. Refer to StudyOhlcPlotDefaultPreferences. |
palettes | Default palette colors. Keys are palette id values from palettes. |
bands | Default band styles, in the same order as bands. Refer to StudyBandDefaultStyle. |
bandsBackground | Default style of the background between the first two bands. Refer to StudyBandBackgroundPreferences. |
areaBackground | Not applicable to custom indicators. Use filledAreasStyle instead. |
filledAreasStyle | Default filled area styles. Keys are filled area id values from filledAreas. Refer to StudyFilledAreaStyle. |
graphics | Default styles of the indicator graphics. Refer to StudyGraphicsDefaults. |
precision | Not used. To set the precision of indicator values, use format. |
Your custom indicator will not work unless you provide values in defaults for each input parameter.
styles
Style properties depend on the plot type.
| Plot type | Interface |
|---|---|
line | StudyLinePlotDefaultPreferences |
shapes | StudyShapesPlotDefaultPreferences |
chars | StudyCharsPlotDefaultPreferences |
arrows | StudyArrowsPlotPreferences |
Other plot types do not have styles in defaults. Colorers use palettes, and OHLC plots use ohlcPlots.
The size of shapes and chars is not part of defaults.
To change it, specify size in the plot's styles in StudyMetaInfo.
Refer to PlotSymbolSize for possible values.
metainfo: {
    // ...
    plots: [{ id: "plot_0", type: "shapes" }],
    styles: {
        plot_0: {
            title: "Signal",
            size: "huge",
        },
    },
    defaults: {
        styles: {
            plot_0: {
                plottype: "shape_arrow_down",
                location: "AboveBar",
                color: "#F23645",
                textColor: "#F23645",
                visible: true,
            },
        },
    },
}
palettes
Each palette in defaults contains only colors. Refer to StudyPaletteStyle for more information.
Specify valToIndex and addDefaultColor in palettes in StudyMetaInfo.
defaults: {
    palettes: {
        palette_0: {
            colors: {
                0: { color: "#089981", style: 0, width: 1 },
                1: { color: "#F23645", style: 0, width: 1 },
            },
        },
    },
}