How to run the library
This tutorial describes how to run the library on your machine. You can also watch the video below that demonstrates running the library step-by-step.
Prepare the project
Download the library ZIP file from the Advanced Charts 🔐 (access is restricted) / Trading Platform 🔐 (access is restricted) repository.
Create a new folder (
examplein this tutorial). Copy thecharting_libraryanddatafeedfolders from the archive toexample.Create the following
index.htmlfile in theexamplefolder:/example/index.html<!DOCTYPE HTML>
<html lang="en">
<head>
<meta charset = "UTF-8">
<meta http-equiv="X-UA-Compatible" content="IE=edge">
<meta name="viewport" content="width=device-width, initial-scale=1.0">
</head>
<body>
</body>
</html>Add two script references into the
<head>section:<script src="charting_library/charting_library.standalone.js"></script>
<script src="datafeeds/udf/dist/bundle.js"></script>charting_library/charting_library.standalone.jscontains the code that creates the chart widget.datafeeds/udf/dist/bundle.jscontains a sample datafeed implementation that loads data to the chart.
Define the container for the chart in the
<body>section:<div id="chartContainer"></div>To create a chart, you should initialize the Widget Constructor in
<body>. To do this, configure some basic Widget Constructor parameters:<script>
new TradingView.widget({
container: 'chartContainer',
locale: 'en',
library_path: 'charting_library/',
datafeed: new Datafeeds.UDFCompatibleDatafeed("https://demo-feed-data.tradingview.com"),
symbol: 'AAPL',
interval: '1D',
fullscreen: true,
debug: true
});
</script>containeris set to the container ID from the previous step.library_pathspecifies a path to additional HTML, JavaScript, and CSS files that allow you to render the chart. In this tutorial, thecharting_libraryfolder stores these files.datafeedis set to theUDFCompatibleDatafeedsample that TradingView provides.
Run the library
Execute the following command in the
examplefolder to run the library locally.# Python 2.x
python -m SimpleHTTPServer 9090
# Python 3.x
python -m http.server 9090In this tutorial, the Python
http.servermodule is used. You can use any server/port that you prefer. The tips below explain how to run the most common HTTP servers.Node.js
Install
http-server.npm install http-server -gStart
http-serverusing the following command in the library folder.http-server -p 9090
NGINX
Install NGINX.
Open the
nginx.conffile and insert the following code into thehttpsection of the file:server {
listen 9090;
server_name localhost;
location / {
root ABSOLUTE_PATH_TO_THE_TUTORIAL_FOLDER;
}
}Replace
ABSOLUTE_PATH_TO_THE_TUTORIAL_FOLDERwith the absolute path to the tutorial folder (examplein this tutorial).Run NGINX.
Open
http://localhost:9090/in your web browser to see the result.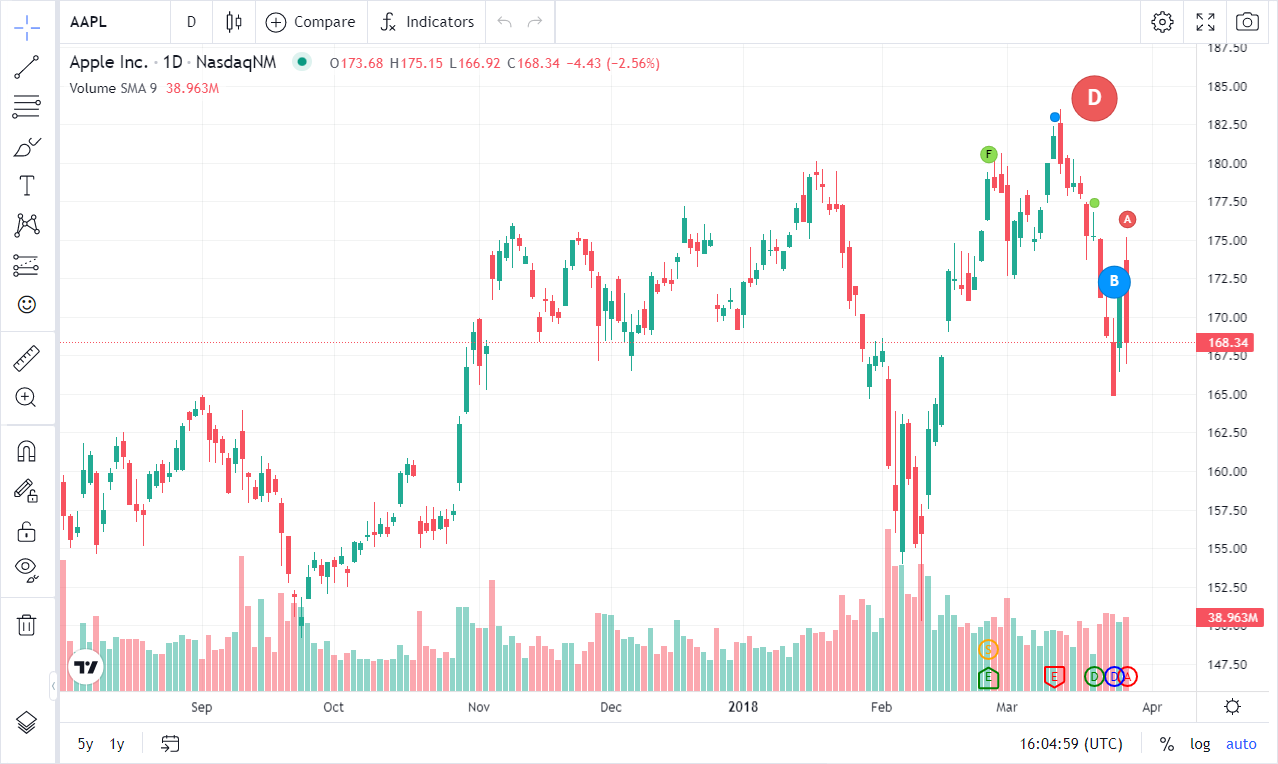
Complete code
<!DOCTYPE HTML>
<html lang="en">
<head>
<meta charset = "UTF-8">
<meta http-equiv="X-UA-Compatible" content="IE=edge">
<meta name="viewport" content="width=device-width, initial-scale=1.0">
<title>TradingView - Advanced Charts</title>
<script src="charting_library/charting_library.standalone.js"></script>
<script src="datafeeds/udf/dist/bundle.js"></script>
</head>
<body>
<div id="chartContainer"></div>
<script>
new TradingView.widget({
container: 'chartContainer',
locale: 'en',
library_path: 'charting_library/',
datafeed: new Datafeeds.UDFCompatibleDatafeed("https://demo-feed-data.tradingview.com"),
symbol: 'AAPL',
interval: '1D',
fullscreen: true,
debug: true,
});
</script>
</body>
</html>
What's next?
In this tutorial, you have set up Widget Constructor and a static chart. You can follow the How to connect data via Datafeed API tutorial to learn more about implementing real-time data streaming.