Resolution
Overview
Resolution or time interval is a time period of a single bar. Changing the resolution allows users to switch between different levels of detail, from short-term intraday moves to long-term historical trends.
This article explains how to:
- Specify resolutions in the correct format.
- Set up the default resolution for the chart.
- Change the resolution in the UI or using the API.
- Adjust additional settings, such as disabling resolution changes or enabling custom resolutions.
For more information on how to configure resolutions on the datafeed side, see Configure resolutions in datafeed.
Resolution format
The library supports resolutions in seconds, minutes, hours, days, weeks, months, years, and ticks.
A resolution value should have the ResolutionString type.
The table below describes how to specify different resolution values. In these values, x represents a number of units.
| Resolution | Format | Example |
|---|---|---|
| Ticks | xT | 1T — one tick, 5T — five ticks, 100T — one hundred ticks |
| Seconds | xS | 1S — one second, 2S — two seconds, 100S — one hundred seconds |
| Minutes | x | 1 — one minute, 2 — two minutes, 100 — one hundred minutes |
| Hours | x minutes | 60 — one hour, 120 — two hours, 240 — four hours |
| Days | xD | 1D — one day, 2D — two days, 100D — one hundred days |
| Weeks | xW | 1W — one week, 2W — two weeks, 100W — one hundred weeks |
| Months | xM | 1M — one month, 2M — two months, 100M — one hundred months |
| Years | xM months | 12M — one year, 24M — two years, 48M — four years |
You can also omit the number of units if it is equal to 1. For example, you can use D instead of 1D and W instead of 1W.
Set up resolution on the chart
The resolution is initialized in the Widget Constructor and can be changed in the UI or using the API.
To get the current resolution, use the resolution method.
widget.onChartReady(() => {
    widget.activeChart().resolution();
});
Default resolution
You can specify the default resolution using the interval property in the Widget Constructor.
new TradingView.widget({
    // ...
    interval: '1D',
});
In UI
Users can change the resolution in the following ways:
-
Use the Resolution button on the top toolbar.
-
Use the Resolution button in the Legend.
-
Press any digit key or the , (comma) key.
To disable any of the methods above, refer to Disable resolution changing.
Using API
You can use the setResolution method to change the resolution on the fly.
widget.onChartReady(() => {
    widget.activeChart().setResolution('2M');
});
In the UI, users can enter values like 2h to specify a number of hours. However, you should specify hour resolutions in minutes, for example 120, if you change the resolution using the API.
Additional settings
You can use featuresets to adjust resolution settings.
Disable resolution rebuilding
The library aligns bars to the nearest expected bar position. For example, if session is 0915-1530 and the chart shows a 5-minute resolution, the library expects the following bar timestamps: [09:15, 09:20, 09:25, ...].
If your datafeed provides a bar with the 09:17 timestamp, the library changes this timestamp to 09:15.
You can use the disable_resolution_rebuild featureset to display bars exactly as your datafeed provides.
If you enable the disable_resolution_rebuild featureset, the library cannot build resolutions that your datafeed does not explicitly provide. For example, the library cannot build a 5-minute resolution from 1-minute data.
Enable custom resolutions
Users can add their custom resolutions in the UI. To allow this feature, do the following:
-
Enable the
custom_resolutionsfeatureset that displays the corresponding button in the UI. -
Specify the list of resolutions that the certain symbol supports in the
LibrarySymbolInfo.supported_resolutionsproperty. Users can add any resolution, but it will be disabled if it is not included in this list.
Note that you do not need to provide data for every resolution you want to support. The library can build additional resolutions from the available data. Make sure to specify a list of resolutions that your datafeed provides in the *_multipliers properties (seconds_multipliers, daily_multipliers, etc.).
Example
The default list of resolutions for the chart is specified in the DatafeedConfiguration.supported_resolutions property. It includes 1-minute, 2-minute, and 5-minute resolutions. These resolutions will be displayed for all symbols, even if a certain symbol does not support them.
// DatafeedConfiguration object
{
    //...
    supported_resolutions = ["1", "2", "5"]; // Resolutions displayed in the list by default
};
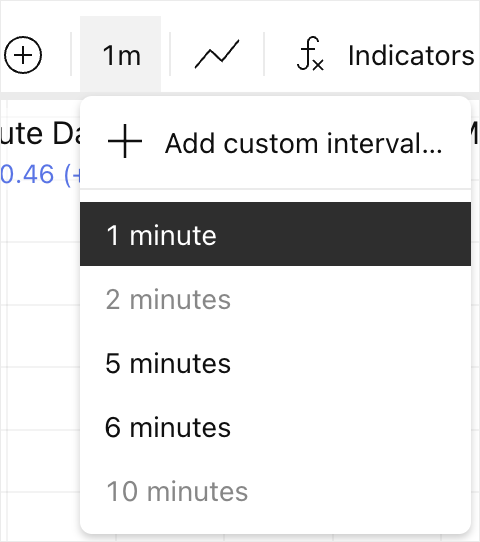
AAPL supports 1-minute, 5-minute, and 6-minute resolutions, as specified in LibrarySymbolInfo.supported_resolutions.
The symbol does not support 2-minute resolution, therefore, it will be disabled in the UI. The 6-minute resolution is not displayed by default, but it will be available if users add it manually.
// LibrarySymbolInfo object for AAPL
{
    "has_intraday": true,
    "supported_resolutions": ["1", "5", "6"], // Resolutions that the symbol supports
    "intraday_multipliers": ["1"], // Resolutions that your datafeed provides
    //...
}
If users enter an unsupported resolution such as 10 minutes, it will still appear in the list but will be disabled.
Disable resolution changing
You can use the header_resolutions featureset to remove the Resolution button from the top toolbar.
![]()
To disable resolution changing in the Legend, use the legend_inplace_edit featureset.
If you want to completely remove the Resolution button from the Legend, use the hide_resolution_in_legend featureset.
To disable the Resolution shortcut, use the show_interval_dialog_on_key_press featureset.