Version 33.0.0
Welcome to Version 33.0.0.
This major release adds Session Volume Profile as a chart type and an indicator, lets custom indicators sit under the price action the way the built-in Volume does, and ships a datafeed skill your coding assistant can load. Three breaking changes need your attention: shortcuts, custom fields on trading entities, and grid line visibility. Let's dive into the highlights.
Breaking changes
Shortcuts take numeric key codes only
String key names in shortcut definitions, deprecated in version 30, have been removed.
Passing a printable character to onShortcut, as a single string such as 'ctrl+shift+/' or as an array element, now throws an error.
Pass the numeric key code instead.
Modifier keys (ctrl, shift, alt, and meta/cmd/command) are still accepted as strings.
// Before: the printable character '/' as a string.
widget.onShortcut(['ctrl', 'shift', '/'], () => openHelp());

// After: the numeric key code for '/'.
widget.onShortcut(['ctrl', 'shift', 191], () => openHelp());
Refer to Transition to key code-based shortcuts for the full procedure and a key code lookup.
A prompt for your AI assistant that converts the shortcuts.
Point it at your codebase.
Find every widget.onShortcut() call in this codebase that passes a printable
character as a key, either as a single string such as 'ctrl+shift+/' or inside
an array such as ['ctrl', 'shift', '/'].

Replace each printable character with its numeric KeyboardEvent.keyCode value,
and keep the modifiers 'ctrl', 'shift', 'alt', 'meta', 'cmd', and 'command' as
strings. For example, ['ctrl', 'shift', '/'] becomes ['ctrl', 'shift', 191].

Leave calls that already pass numeric key codes unchanged, and list every file
you edited with the before and after for each call.
Custom fields on trading entities move into extra
In Trading Platform, PlacedOrder, Position, IndividualPosition, and Execution accepted any property you added, because each extended a CustomFields interface whose index signature allowed it.
That interface has been removed. The types now extend WithExtraData, which gives each one a single extra object for everything your broker adds.
// Before: custom fields alongside the library's own properties.
{ id: '1', symbol: 'AAPL', qty: 10, riskLevel: 'high' }

// After: custom fields inside `extra`.
{ id: '1', symbol: 'AAPL', qty: 10, extra: { riskLevel: 'high' } }
Wherever your code reads a custom field, read it from extra instead, for example, order.riskLevel becomes order.extra?.riskLevel.
In an Account Manager column, dataFields now needs the path to a custom field rather than its name.
// Before
dataFields: ['riskLevel'],

// After
dataFields: [['extra', 'riskLevel']],
Columns that read the library's own fields are unaffected.
A prompt for your AI assistant that moves the fields.
Point it at your Broker API implementation.
This codebase implements the TradingView Broker API. Custom properties on
PlacedOrder, Position, IndividualPosition, and Execution have moved into a nested
`extra` object. Migrate the codebase in three steps.

1. Find every object literal typed as one of those four, typically the values
   returned from orders(), positions(), individualPositions(), and executions(),
   and the objects passed to orderUpdate(), positionUpdate(),
   individualPositionUpdate(), and executionUpdate(). Keep the properties the
   library's interface declares where they are, and move every other property
   into `extra`. Report the names you moved.

2. Find every read of one of those names off one of those objects anywhere in
   the codebase, including property access, destructuring and string keys, and
   repoint it through `extra`.

3. Update the Account Manager configuration. In every column, replace each
   dataFields entry that refers to a moved property with ['extra', '<name>'].
   Do the same in any custom formatter that reads such a property off the whole
   data object.

List each file you changed, with the before and after.
Grid line visibility moves to per-axis flags
paneProperties.gridLinesMode, which took 'both', 'vert', 'horz', or 'none', has been removed in favor of two booleans.
// Before
overrides: { 'paneProperties.gridLinesMode': 'horz' }

// After
overrides: {
    'paneProperties.vertGridProperties.visible': false,
    'paneProperties.horzGridProperties.visible': true,
}
Grid lines are also dotted and less transparent by default.
Set style to 0 and pick your own color on the same properties to restore the previous look.
Saved layouts are migrated to the new flags, but they pick up the new line style as well, so existing charts change appearance.
A prompt for your AI assistant that updates the overrides.
Point it at your codebase.
In this codebase, find every use of the TradingView chart override
'paneProperties.gridLinesMode', both in the overrides object passed to the
widget constructor and in any applyOverrides() call.

Replace each one with the two boolean overrides that supersede it,
'paneProperties.vertGridProperties.visible' and
'paneProperties.horzGridProperties.visible', mapping the old value as follows:
'both' sets both to true, 'vert' sets vert true and horz false, 'horz' sets
vert false and horz true, and 'none' sets both to false.

List every file you changed, with the before and after.
Key updates
Session Volume Profile
Trading Platform adds Session Volume Profile, both as a chart type and as a standalone indicator. It splits history into trading sessions and draws a horizontal histogram for each one, with its Point of Control and Value Area.
The chart type is SeriesType.SVP with the numeric value 20, and you can preset it through the mainSeriesProperties.svpStyle overrides.
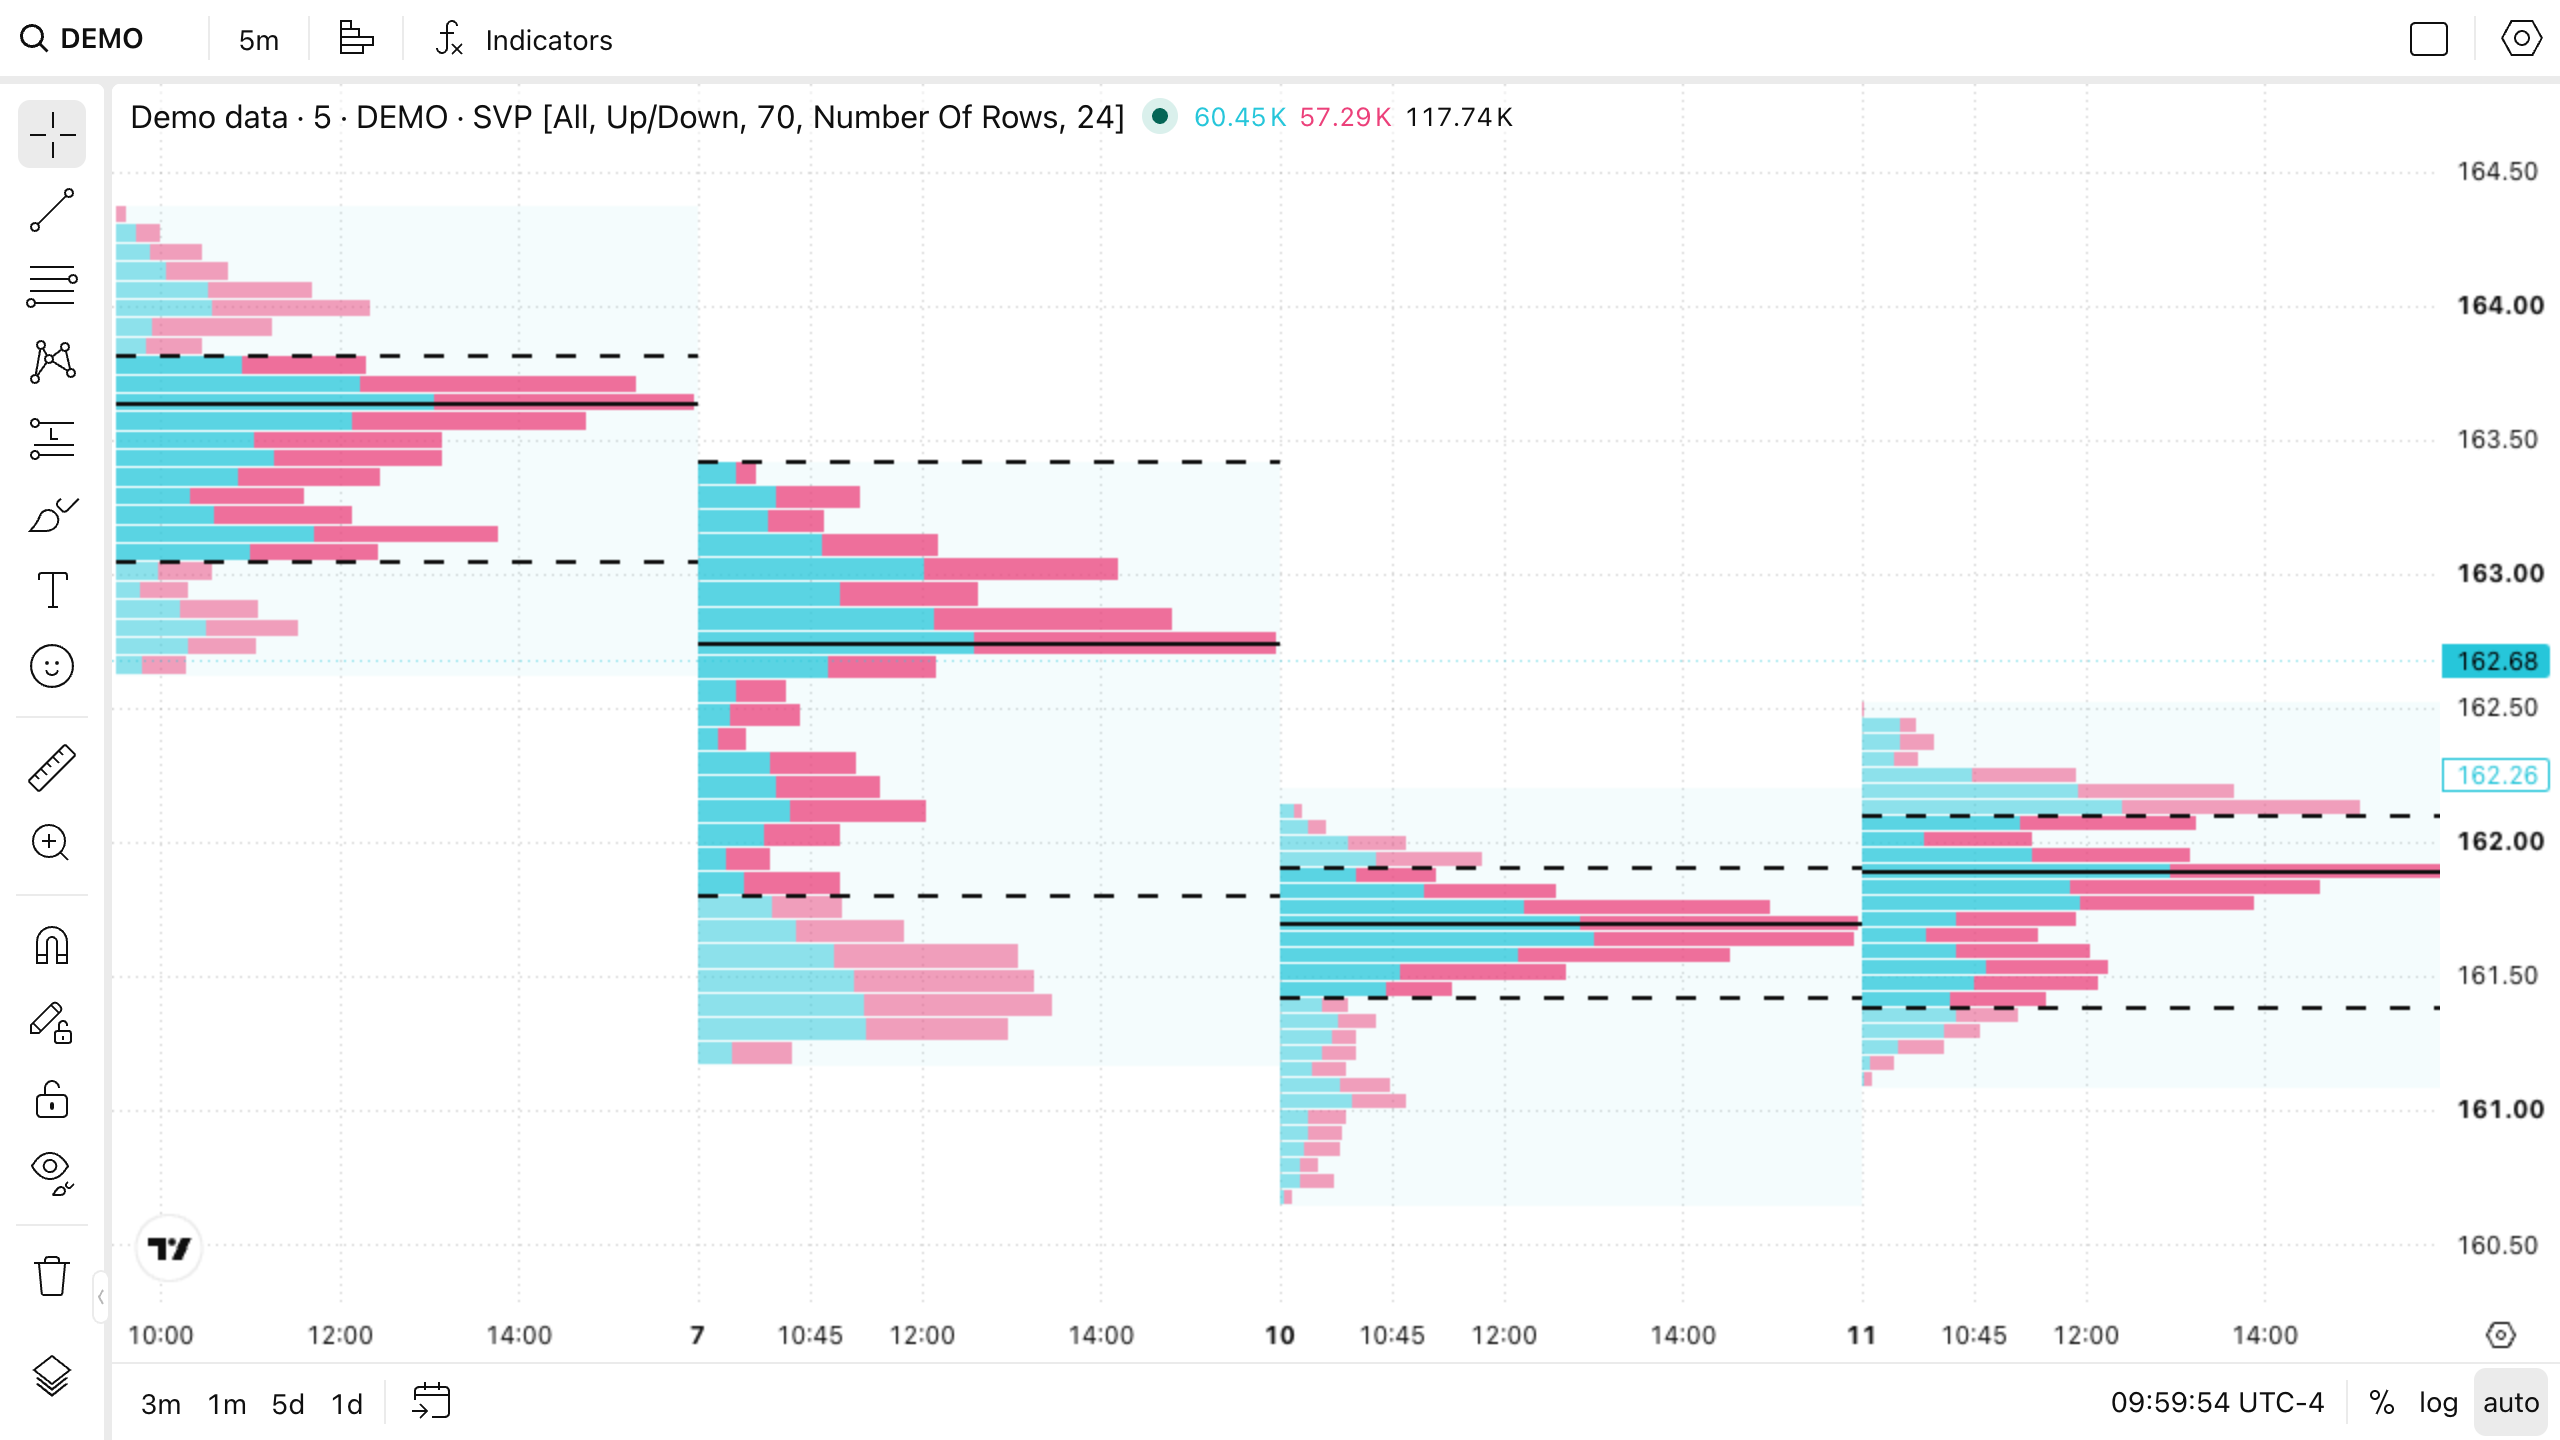
The indicator requires volume data, supports intraday resolutions and 1D, and may request an additional series at a finer resolution through getBars, so plan for that request in your datafeed.
Refer to Session Volume Profile for the datafeed requirements and the history settings.
Tuning what volume profiles keep in memory
The new volume_profile widget constructor property applies to every volume profile indicator, in both Advanced Charts and Trading Platform.
volume_profile: {
    // Histogram rows kept across all profiles an indicator has drawn. Default: 6000.
    max_total_rows: 12000,
    history_sessions: 40,
},
max_total_rows bounds how far back a multi-profile indicator draws: once new profiles would push the total past the limit, the oldest ones are dropped.
Raising it costs memory and the time spent laying out the extra rows, so increase it gradually and measure.
history_sessions sets how many sessions Session Volume Profile covers initially. It requires the studies_extend_time_scale featureset, is clamped at 500, and extends the chart's own history.
A datafeed skill your coding assistant can load
The library repository now ships the charting-library-datafeed skill for assistants such as Claude Code, Codex, Cursor, and GitHub Copilot, carrying the library's own rules on the Datafeed API, the UDF adapter, symbology, trading sessions, resolutions, and real-time updates.
npx skills add tradingview/charting_library --skill charting-library-datafeed
It also brings check-datafeed.mjs, which calls your datafeed the way the library does and reports every rule it breaks, the symptom you would see on the chart, and the page that explains it.
The script needs Node.js 18, has no dependencies, and runs against a datafeed module, a UDF server, or a browser-only datafeed you wrap.
Refer to Agent skills for the options and the install paths.
Place a custom indicator on the series pane
An indicator displayed on the pane of the main series was scaled to the whole pane height, and there was no way to shrink it.
Declare overlayScaleMargins in the indicator metainfo to place it on the series pane without a visible price scale and limit it to part of the pane height, as the built-in Volume indicator is placed.
metainfo: {
    // Fractions of the pane height: the bottom quarter, like the Volume indicator.
    overlayScaleMargins: { top: 0.75, bottom: 0 },

    /* Other metainfo fields */
},
The margins are ignored when the indicator is displayed in its own pane.
Order confirmation you can enforce
When One-click trading is on, an order goes straight to the broker without the Order Ticket.
One-click trading is a user setting, and an integration had no way to keep it disabled: the user can turn it on, a value saved from an earlier session can restore it, and silentOrdersPlacement can enable it from your own code.
Enable the always_require_order_confirmation featureset in Trading Platform to take the option away.
One-click trading disappears from the settings, and none of those routes can bring it back.
The featureset is read when the chart loads, and it is disabled by default.
Fewer requests when the chart loads
The chart loads its code in lazy chunks, and every chunk is one more request standing between your user and a usable chart. On an HTTP/1 connection, where the browser allows only a handful of requests at a time, that queue is what the user waits on.
Related chunks now ship packaged into delivery groups that follow how they actually load, so a default chart asks for about 40 fewer files at startup and a bare one about 25 fewer. You get this by upgrading; there is nothing to configure.
Conclusion
This release also includes important bug fixes: changeTheme no longer discards chart property overrides, the Resolution drop-down honors the datafeed's supported_resolutions in worker mode, and the Add custom interval dialog offers second and tick options again.
For the full list of updates, improvements, and fixes, see the Release notes.